Warning
This article and series is specifically targeted for anyone involved or interested in oil and gas reserves reporting guidelines, methods, issues, calculations and pitfalls. Proceed at your own risk!
Introduction
Reserve reports typically present the lifetime oil and gas reserves and expected cash flows for a commercial entity that has ownership in a specific set of properties. The report could involve only one well, or possibly tens of thousands of wells spread out in numerous productive basins targeting different reservoirs and involving various operators. Any proper reserve report should describe the entity, the purpose for the report and detail any complexities so the reader can be fully informed. Most importantly, summary cash flow tables are the “main event” of the reserve report effort, where reserves and values are shown in one very detailed page. It should be pointed out, however, that reserves and cash flows shown in reserve reports DO NOT take into account interest payments, debt service or federal income taxes unless specifically noted. Herein, we will take a brief tour of a reserves-based cash flow page and explain some of its nuances, leave you with an explanatory reference guide, and throw in a bonus rate-versus-time graph to drive home how forecasted production is converted to dollars and discounted cash flow.
Explanatory Comments Guide
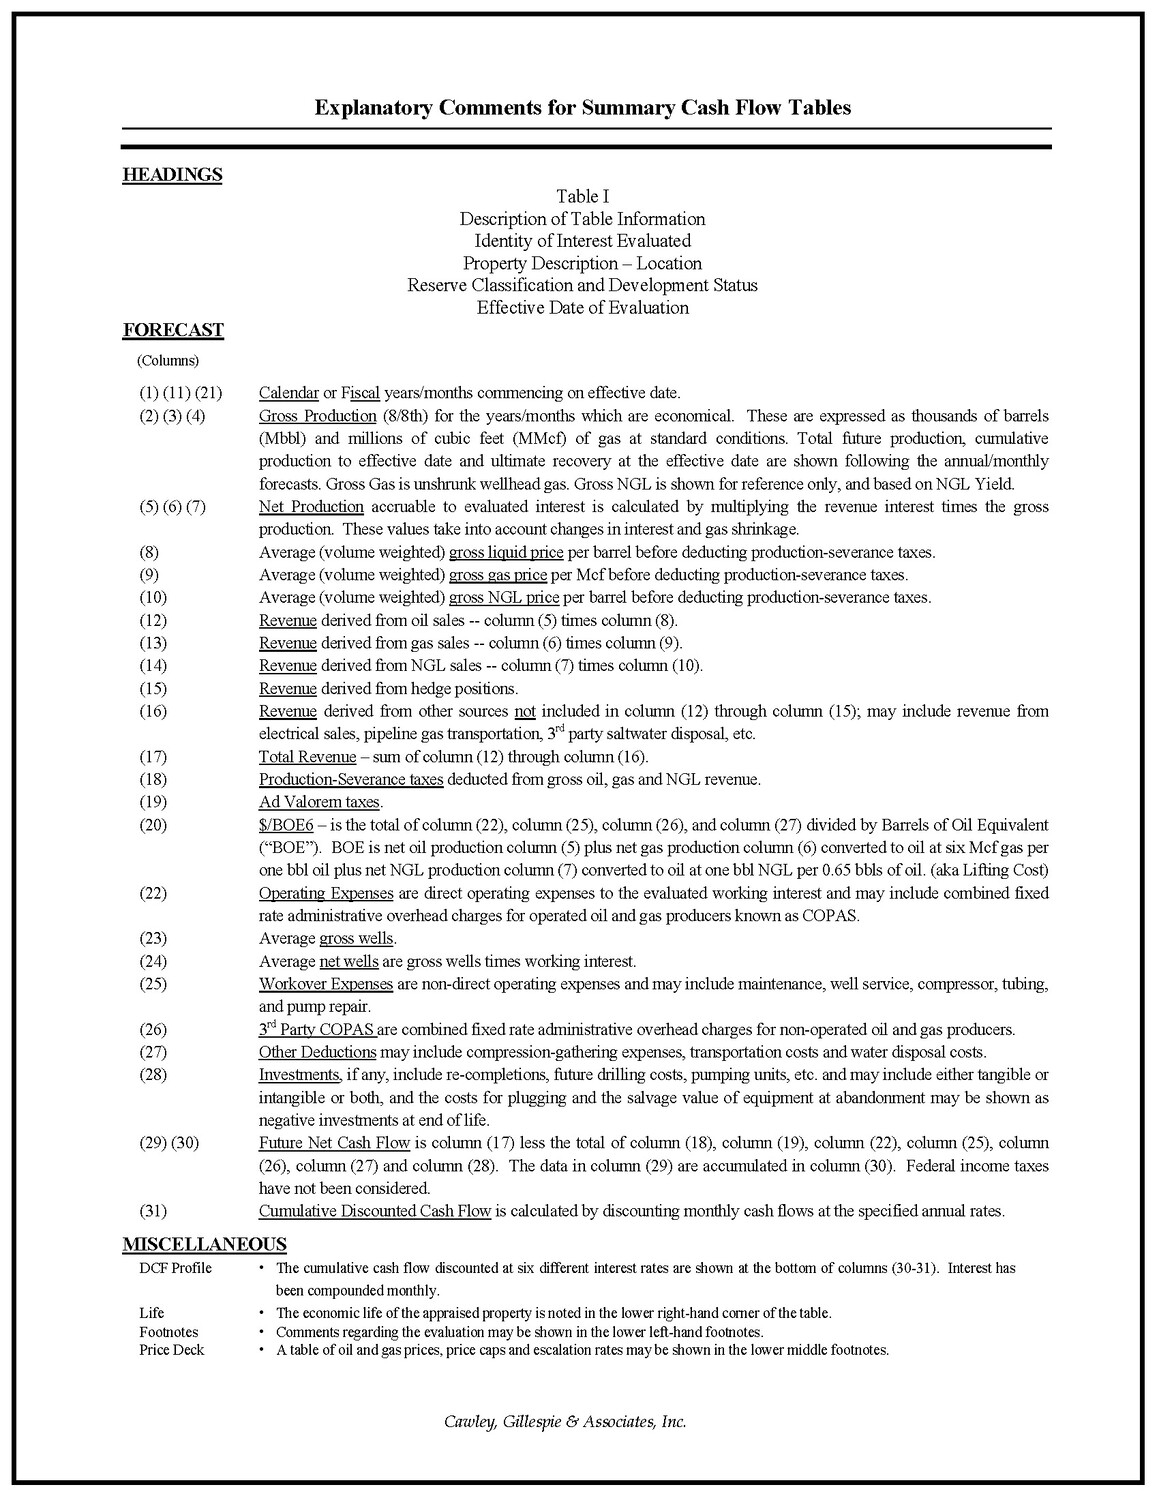
In every reserve report that we publish, we provide an explanatory guide that describes the detail in a summary cash flow page. This guide is very important to include so that we can be sure that any reader of our report will have all the tools needed to better understand the reserves and cash flows. Please refer to the “Explanatory Comments for Summary Cash Flow Tables” page below in Figure 2 when reviewing the elements in the cash flow page in Figure 1.
A closer look at Figure 2 reveals the details in each cash flow page. Not only does it describe what information is contained with each of the 31 columns, it also describes the math that goes into calculating each set of numbers. Furthermore, Figure 2 lists the various components that go into each calculation, such as “Other Deductions” which typically represents variable operating expenses like compression or gathering expenses, transportation costs, and/or water disposal costs.
One nuance that I can point out in the cash flow statement (Figure 1) above is that you should notice that net product sales are shown for oil, gas and natural gas liquids (NGLs). This is a clear signal that at least SOME of the natural gas flows through a processing plant where residue gas (net gas sales) and NGL’s (net NGL sales) are sold at the tailgate. If the Net NGL Production (column 7) was zero, then that is a signal that natural gas sales in the reserve report were modeled as wet gas sales (unprocessed).
Without going into every detail about cash flow statements in this article, we have provided Figure 2 below for your reference and education.

Read Part III of the series – Production Rate vs Time Graph (Semilog)


